As I said before I distributed assets on 1900 population patterns.
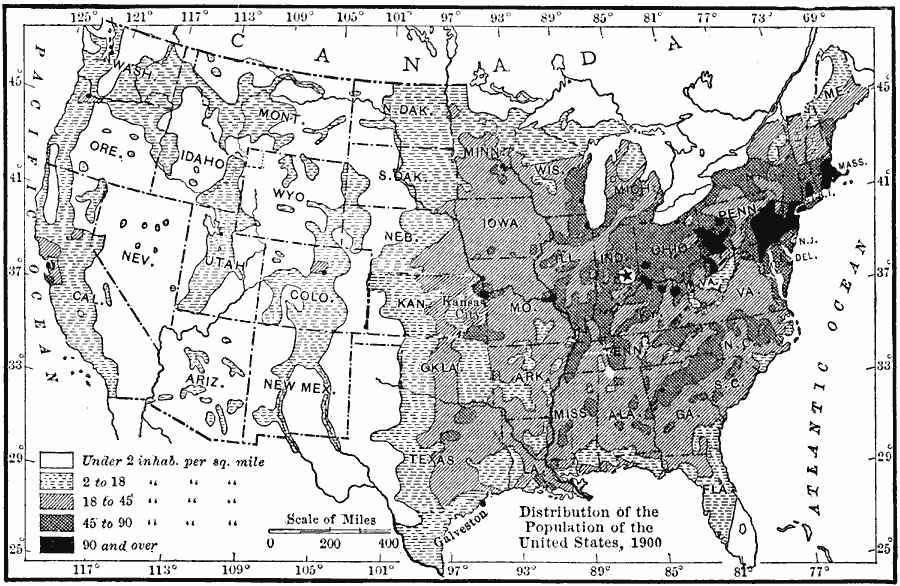
This maps shows areas that were not generally populated without more advanced technology.
Breaking down the regions I would adjust team placement for the following.
Pop per sq mile
- 0-2 - Generally not worth the projects attention. Unless there is a unique resource teams would be very sparse in these areas.
- 2-18 - Migration support. These are areas which might be able to support a larger population with enhancements to infrastructure.
- 18-45 - Population support. This is where I feel a bulk of the survivors will be. These are areas which can support communities but are not large enough to be primary targets.
- 45-90 - Resource Recovery. Some of these areas will be able to support life but will probably have a breakdown due to a lack of ability for populations to feed themselves and the proximity to nuclear strikes. However there will be quite a few resources in these areas which will be useful to assist other populated zones.
- 90+ - Highly targeted - Few project resources assigned simply due to the fact that most of the people and the resources in these areas will be destroyed by primary and secondary effects of the war.
These are of course generalizations. The West Coast and Florida would have had significant population growth. The overall strength of the Midwest particularly the 18-45 range can be seen though.